Last Updated on March 17, 2024 by Ben
Student loan debt in the United States totals $1.774 trillion. The debt accumulation rate is slowing, and recent analytics indicate that most consumers manage their student loan debt responsibly.
- The outstanding federal loan balance is $1.644 trillion, accounting for 92.6% of all student loan debt.
- 43.6 million borrowers have federal student loan debt.
- The average federal student loan debt balance is $37,717, while the total average balance (including private loan debt) may be as high as $40,505.
- Less than 2% of private student loans enter default as of 2021’s fourth financial quarter (2021 Q4).
- The average public university student borrows $25,969 to attain a bachelor’s degree.
Average Student Loan Debt in the United States as of Today


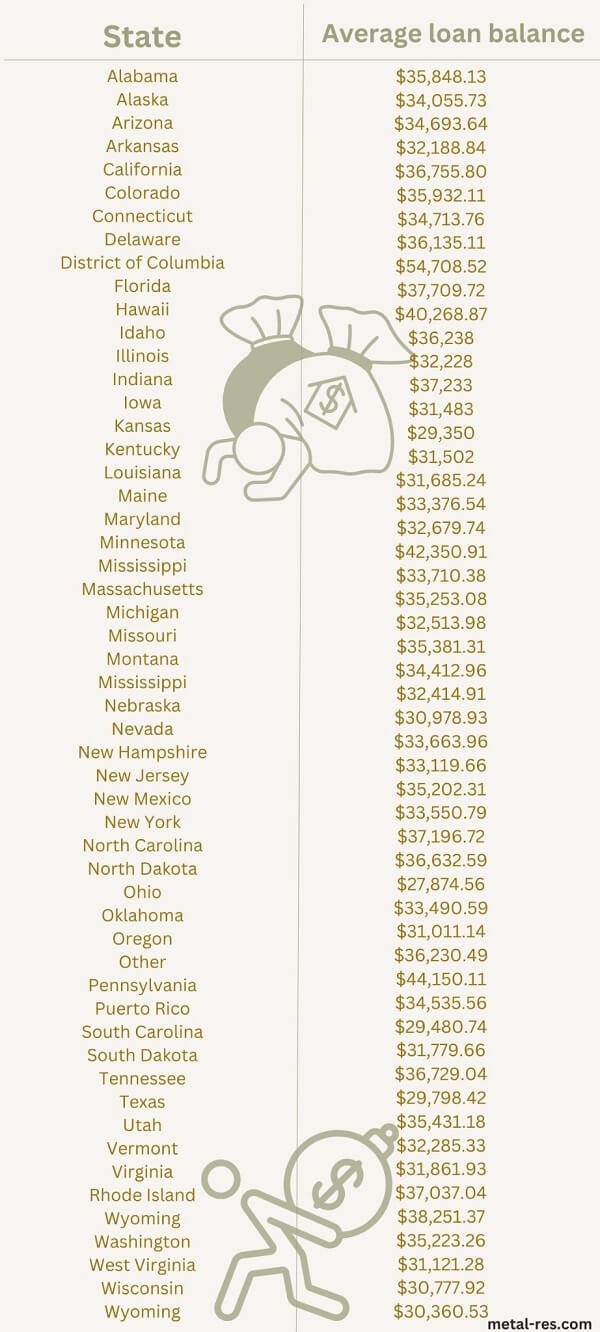
- $1.75 trillion in total student loan debt (including national and private loans)
- $28,950 owed per borrower on average
- About 92% of all student debt is federal student loans; the remaining amount is private student loans
- 55% of students from public four-year institutions had student loans
- 57% of students from private nonprofit four-year institutions took on education debt


Total Federal Student Loan Debt in the United States as of Today
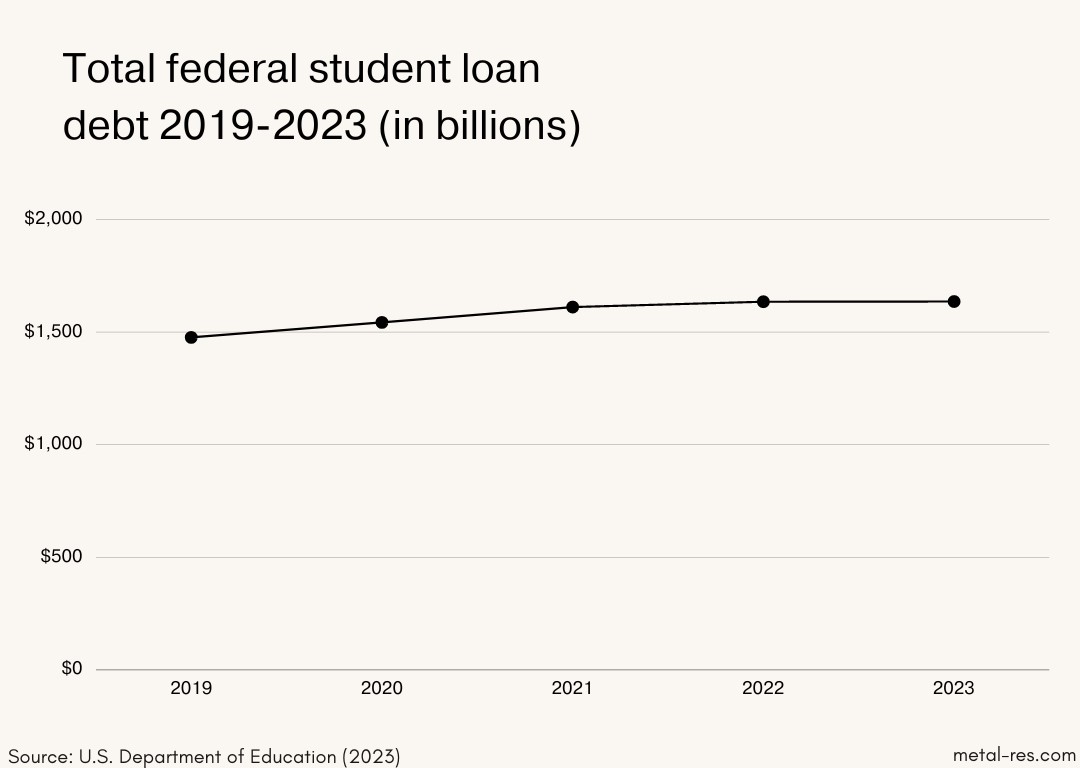


The Department of Education says the total government student loan debt is $1.6 trillion. Since March 2020, when the Department of Education got rid of interest and let people stop making payments, the total government student loan debt has grown by 0.64 percent per quarter.
In 2013, there was $948 billion in government student loan debt. By the end of the third quarter of 2013, government student loan debt had exceeded $1 trillion. The highest federal student loan debt was $1.62 trillion in the second quarter of 2022.
5 Years of Student Debt: A Detailed Analysis
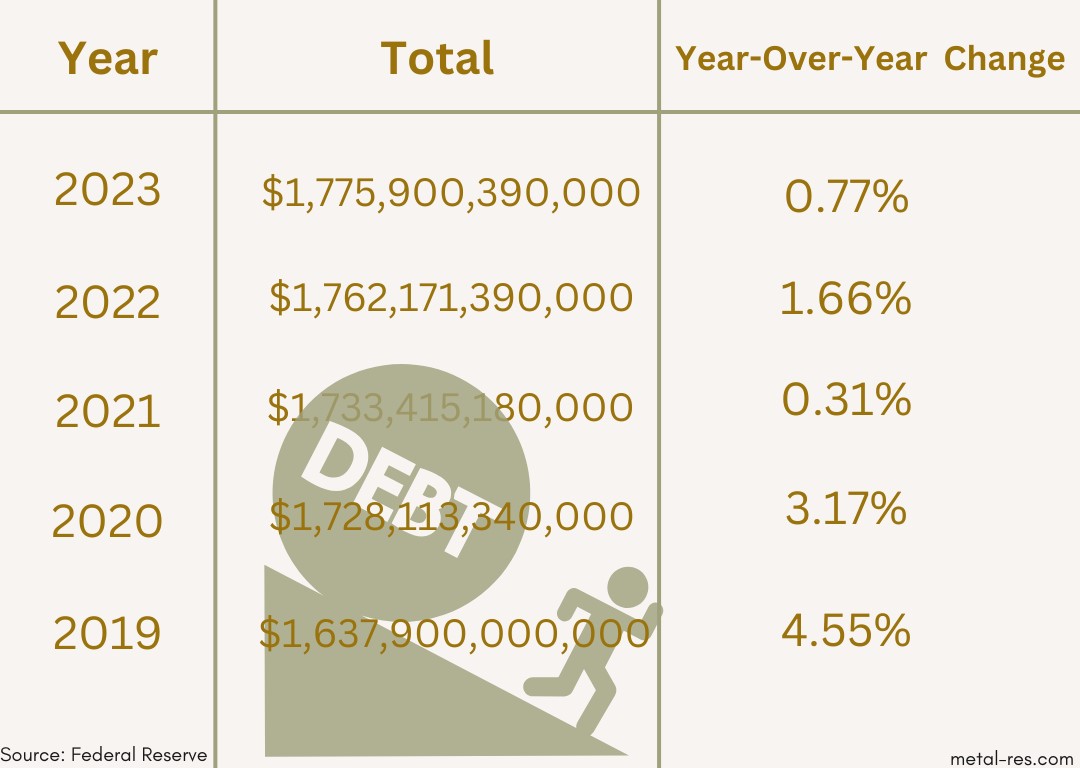


Our comprehensive analysis unveils key trends, shedding light on the evolving landscape of financial challenges faced by students.
2023 Student Loan Debt Statistics
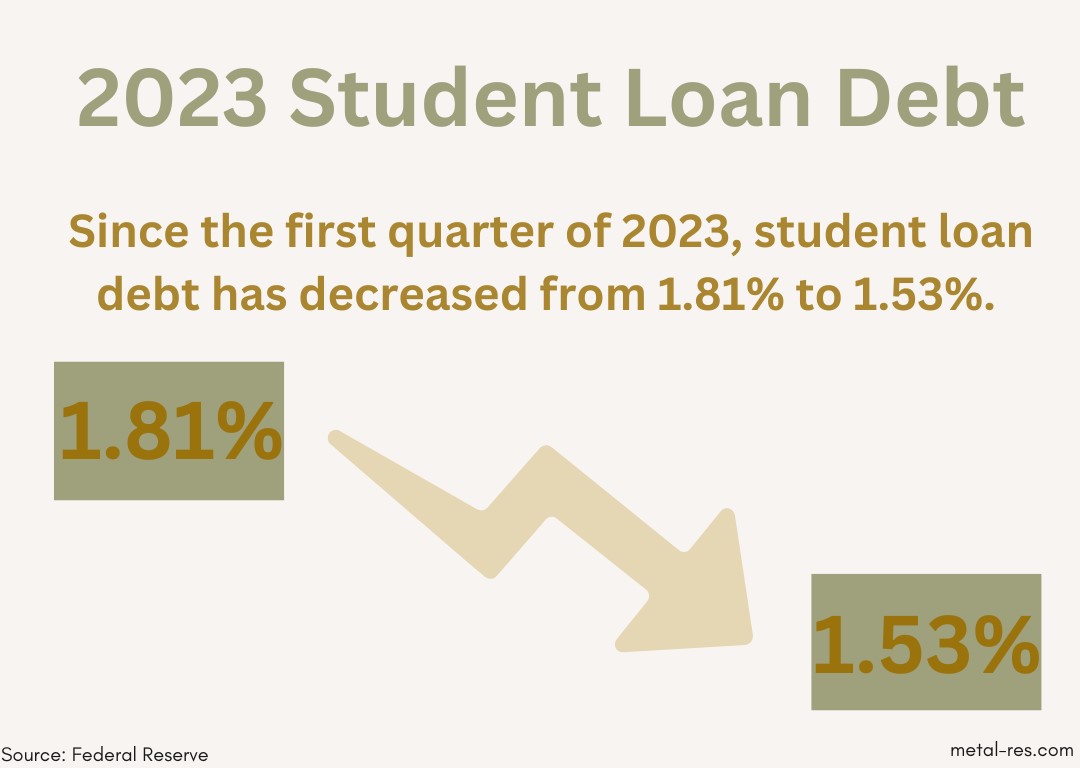


- National student loan debt only increased by 1.53% in the second financial quarter of 2023, maintaining a low growth trend since the last quarter of 2022.
- The national student debt balance decreased from the second financial quarter of 2023 to the second financial quarter of 2023 at a difference of 0.22% reduction.
- Since the first quarter of 2023, student loan debt has decreased from 1.81% to 1.53%.
- Federal and private student loan debt has increased by roughly $10 billion from the first to the second fiscal quarter of 2023.
2022 Student Loan Debt Statistics


- The total national student loan debt increased 1.48% year over year in the fourth financial quarter of 2022, the lowest rate increase in the 21st century.
- From 2022 Q1 to 2022 Q2, the national student loan debt balance declined by 0.21%; this is 21% lower than the average quarterly change since the first financial quarter of 2006.
- Since the first quarter of 2020, the quarterly rate of increase has accelerated by 5.5% as of 2023 Q1.
- Also, in 2022 Q2, 92.7% of all student loan debt was federal; 7.3% belonged to private borrowers.
- In 2022 Q3, Federal student loan debt declined by 0.15%.
- Federal student loan debt declined 0.27% in 2022 Q1; this is the most significant quarterly decline in at least a decade.
- The average federal debt increased by $119.94 in 2022 Q3.
- The federal share of the total student loan debt balance increased by 18.4% from 2017 Q2 to 2022 Q2.
2021 Student Loan Debt Statistics


- With $1.76 trillion in student loan debt at the end of 2021, the U.S. saw a 3.5% year-on-year increase from the recorded $1.70 in 2020. Over the past decade, total student loan debt grew by 82.21%.
- The 2021 student loan total was mainly driven by federal student loan debt. The federal government handled around 92% of the debt. The remaining 8% was from private institutions.
- In 2021, the federal government shouldered approximately 92% of total student loan debt. That means around 43.4 million borrowers had national student loan debt. Depending on the federal student loan and borrower type, the interest rate for undergraduates can range from 3.73% to 4.53% for the past two years.
- Due to the CARES Act, most federal loans have a 0.0% interest rate until after Aug. 31, 2022. The average national student loan debt by the end of 2021 was $36,510 per borrower.
- In total, the balance for private student loans exceeded $140 billion. On average, personal student loan debt was $54,921 per borrower.
2020 Student Loan Debt Statistics


- Oakland, CA – Student Debt and the Class of 2020, TICAS’ sixteenth annual report on debt for bachelor’s degree graduates of public and nonprofit colleges.
- Vast variation in debt levels across states and colleges.
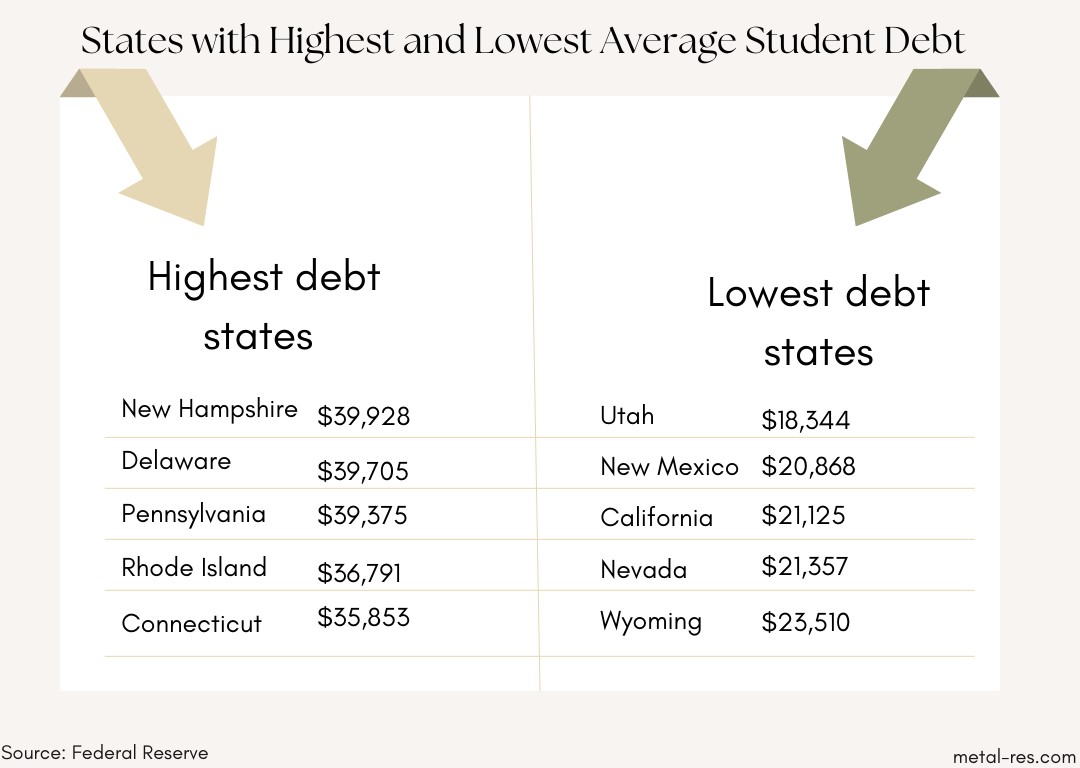
- Average student debt at graduation in 2020 ranged from $18,350 in Utah to $39,950 in New Hampshire.
- Likelihood of having debt varied from 39 percent in Utah to 73 percent in South Dakota.
- Average debt was over $35,000 in six states and more than $30,000 in nineteen states.
- High-debt states had higher average private debt.
- Northeastern states had more private loan borrowing and high average private debt levels.
- West-concentrated states had less private debt.
2019 Student Loan Debt Statistics


- In 2019, over six in ten (62%) college seniors from public and private nonprofit colleges had student loan debt.
- The average student loan debt for these graduates was $28,950.
- This represents a decrease in the share of students with debt compared to the Class of 2018 (65%).
- There was a minor decline (less than 1%) in total debt from the 2018 average of $29,200.
- There are 1.1503 trillion dollars in student loan debt that falls under direct loans
- $277.5 billion of this is Stafford Subsidized
- $469.6 billion falls under Stafford Unsubsidized
- And $767.1 billion is a combination of the two
- There are 34.2 million people who borrowed and owed money under direct federal student loans.
Federal Student Loan Debt Freeze
Introduced between the second and third fiscal quarters of 2020, the CARES Act offered relief for student loan debt that affected an estimated 35 million borrowers.
- Between 2020’s 2nd and 3rd financial quarters, the amount of student loan debt in repayment decreased by 82%, while student debt in forbearance increased by 375%.
- Between the 3rd and 4th financial quarters, student loans in forbearance declined by 0.44%.
- Also, during that period, the number of loans in repayment grew by 33.3%.
- The number of loans in default also declined by 1.79%.
- 56.65% of all debt from federal student loans remains in forbearance until September 2022.
- 26.7 million, or 61.2% of borrowers, have loan intolerance.
- 300,000 or 0.88% of federal student loan borrowers have loans currently in repayment.
- 14% of the student loan debt balance belongs to students still in school.
- 1.38% of the total federal student loan debt is in a grace period.
- 7% of federal debt is in defaulted loans.
Most Americans Say the Benefits of Higher Education Outweigh the Costs
The Federal Reserve says that more than half of Americans who went to college say the financial rewards outweigh the costs. About 20% said the fees did not outweigh the financial rewards, and 30% said the costs and benefits were about the same.
People of different ages and levels of education have other ideas about whether the financial benefits of college are worth the costs.
Younger Americans with less schooling are less likely to think that college’s financial benefits are more than the costs.
Still, more than half of the people in the U.S. with a bachelor’s degree or higher think it is worth the money. Most Americans over 60 with an associate’s degree or higher think the money they spent on school was worth it.
What’s Next for Getting Rid of Student Loans and Getting Out of Debt?
In the past few years, Americans with government student loans have been helped by a pause in payments and the elimination of interest. As a result of the COVID-19 outbreak, fees and interest were put on hold in March 2020.
They are now waiting for a ruling from the U.S. Supreme Court that could wipe out up to $20,000 in federal student loan debt. This summer, the court will make a decision.
Forbearance is set to end, and student loan payments will start either 60 days after the Supreme Court’s decision or 60 days after June 30, 2023, whichever comes first.
Under the plan to forgive federal student loans, people who make less than $125,000 a year or whose households make less than $250,000 are qualified for $10,000 in relief. Americans who got Pell Grants could get an extra $10,000 off their loans for up to $20,000.
The Biden administration says that about 43 million Americans are qualified for federal student loan forgiveness, and the plan could help 20 million of them get rid of their student loan debt.
Final Thought – The Evolution of Student Debt in the US
In the end, the current figures on student loan debt paint a picture of a very tough problem that affects millions of students but also the whole economy of the country. The numbers we’ve talked about are both scary and revealing. They show that we need to change how we pay for college. To stop this crisis from worsening, policymakers, educational institutions, and people must work together. Understanding these numbers is the first step to finding real answers because a society full of educated people shouldn’t have to deal with crippling debt.
